Some Inkscape Tips
As a researcher, having some basic knowledge of a vector graphic tool is a valuable skill. Among the variety of options, Inkscape is a nice open-source project for creating and editing SVG files.
This tool is quite powerful, you can do almost any sort of 2-D vector drawing with it. Such flexibility comes with a cost: there is a steep learning curve for the tool and it can take some efforts to make simple things.
Is it worth investing time in learning Inkscape? To be honest, I don't know. If you need a quick solution to make drawings, you will probably get the job done faster with things like draw.io, excalidraw, or others.
I learned Inkscape because it was the best open-source option at the time I started my career. But I do not regret it. I like to have an offline open-source solution for my drawings that is git-friendly. With a bit of practice, you can produce any kind of diagrams (more that enough for scientific papers). You will also not be afraid to edit SVG files when needed (e.g., stripping a you-don't-know-why-it-is-there margin from matplotlib to make your paper fit the page limit, 5 minutes before a deadline).
In this post, I show some tip to improve the Inkscape experience.
Basic Configuration
For scientific papers, some sort of alignment is always welcome in your illustrations! If find that using a grid is mandatory. You want to do two things:
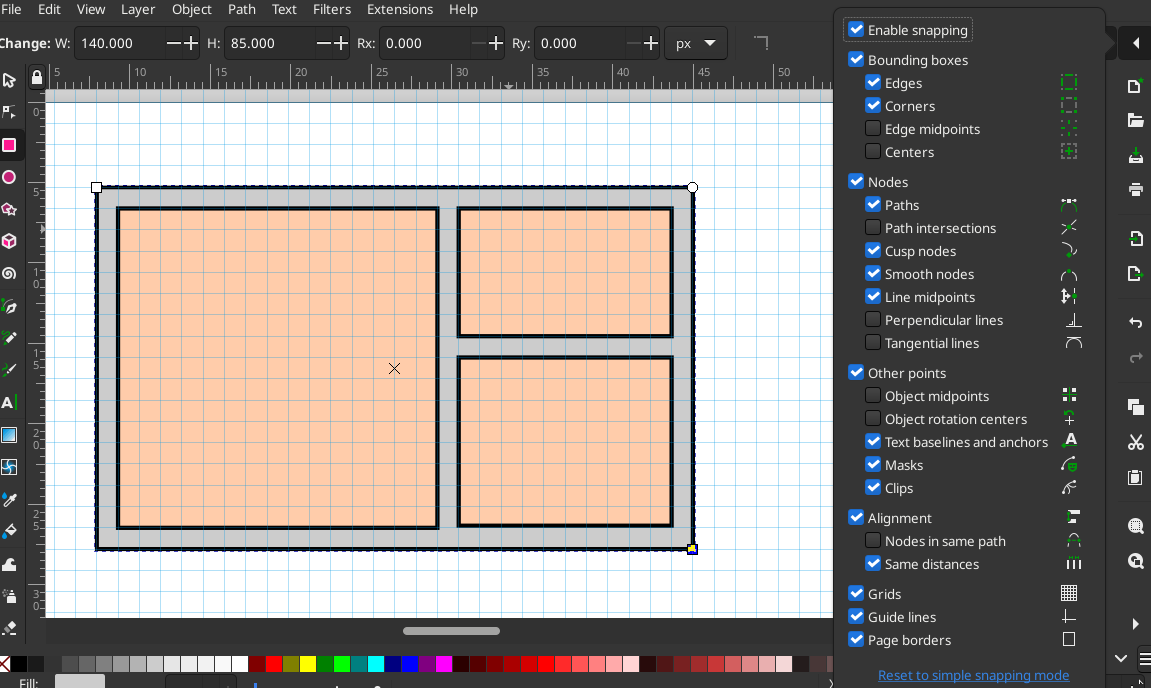
- Display the grid (Press "#" for switching it on/off). Note that you can customize the grid size. There are two grids, primary and secondary. It can be useful to change the spacing and colors in some situations.
- Enable snapping (Press "%" for switching it on/off), so that items like boxes or text will automatically snap to the grid. You can customize how snapping behaves: I find it easier to snap to borders of elements. You want to enable snapping for all items (boxes, text, paths).
This way, you can ensure consistent spacing of items.

Screenshot showing the grid configuration. Aligning items with snapping is so satisfying :)
Use Automatic Alignment
Inkscape has automatic alignment, this feature can save you many clicks! I tend to draw everything and align everything at the end.
Press CTRL-ALT-A to open the alignment pane, then you can select items and align them in different ways.
The important thing to remember here is that alignment is done on the first item of the selection.
Copy style
You do not want to manually replicate style of items.
Once you styled an item (box or whatever), you can copy it with CTRL-C, then you can select a bunch of other items and press CTRL-SHIFT-V, this will apply the style of the first item to your selection.
Conversion
For converting SVG to other formats, I usually export the drawing region. This requires you to properly resize the document to your drawing area. The Inkscape command is quite handly and has tons of options for exporting .svg files.
Export to PDF:
$ inkscape --export-text-to-path -D -o output.pdf input.svg
The --export-text-to-path option is very important. As suggested, it transforms text to paths. Otherwise, text is rendered by the PDF rendering engine and fonts may be missing. By passing this flag, you will have a consistent rendering of your drawings.
Export to PNG:
$ inkscape -D -d 300 -o output.png input.svg
Here, the DPI parameter is set 300.
With release 1.0, the Inkscape command line changed. Here are the versions of those commands for older Inkscape:
$ inkscape --export-text-to-path -D -A output.pdf input.svg
$ inkscape -D -d 300 -e output.png input.svg
Makefile Snippet
A big selling point for Inkscape is that you can save your .svg files inside a git repository and generate exports at build-time using the commands shown in the previous section. This is super convenient for scientific papers.
Note
Once you generate a final version of your paper, I highly recommend saving the figures in some way (I usually add them to git). Inkscape updates can change the rendering. This happened to me several time: the layout of your paper is completely broken because the images generated are not exactly the same (e.g., extra margin).
Then, if you want to be 100% reproducible, snapshot your exported figures!
Here is a snippet that you can integrate in your makefile to automatically build figures.
- .svg source files are assumed to be in directory figs/svg/.
- Type make figs/name_of_fig.pdf to compile name_of_fig.pdf into PDF.
- Type make figs/name_of_fig.png to compile name_of_fig.png into PNG.
INKSCAPE ?= inkscape
INKSCAPE_FLAGS ?=
INKSCAPE_FLAGS += --export-text-to-path
INKSCAPE_VERSION_1 := $(shell inkscape --version | grep -o -E 'Inkscape 1\.[0-9]+')

figs/%.pdf: figs/svg/%.svg
ifeq ($(INKSCAPE_VERSION_1),) # Inkscape < 1.0
    $(INKSCAPE) $(INKSCAPE_FLAGS) -D -A $@ $<
else
    $(INKSCAPE) $(INKSCAPE_FLAGS) -D -o $@ $<
endif

figs/%.png: figs/svg/%.svg
ifeq ($(INKSCAPE_VERSION_1),) # Inkscape < 1.0
    $(INKSCAPE) $(INKSCAPE_FLAGS) -D -d 300 -e $@ $<
else
    $(INKSCAPE) $(INKSCAPE_FLAGS) -D -d 300 -o $@ $<
endif
Hiding Layers for Simple Animations
You can organize your .svg file into multiple layer.
Sometimes, it can be nice to export only some selected layers. Imagine a file having some background image and some layers containing arrows and text annotations. By exporting a subset of layers, it is possible to create an animation that you can include in a slide deck for example.
I have a small script here (~100 lines of Python, without any external dependency) that I use all the time.
Hiding some layers is as simple as:
./exportlayers --hide text_layer_1,text_layer_2 -o fig_background_only.pdf fig.svg
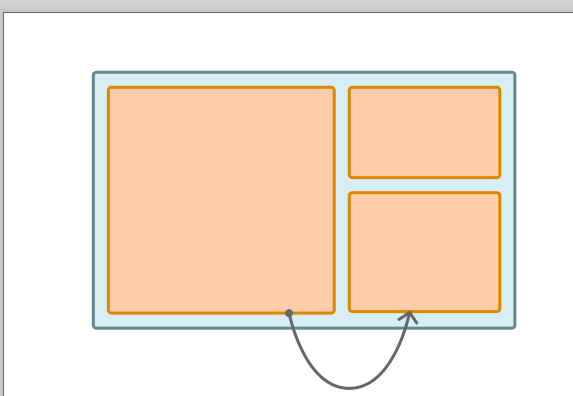
Making you diagram draw.io-ish
If you are afraid that your diagrams will not look as cool as those of your friends made with draw.io, here are a few tips to mimic the draw.io style:
- Enable rounding of borders in "Stroke style", even add a small radius to the corner of boxes.
- Make your borders the same colors of the boxes, but make them slightly darker: show colors in HSL, and reduce the lightness (L).
- Pick a "good-looking" color palette on google and stick to it for your project.

Restyling of the diagram shown in previous section